Contents
Trends
As you collect data from your accounts, you can plot it in charts called trends.
After setting up some trends and collecting some data, you can view trends in the “Trends” tab.

Trends in Reports
The trends you configure will appear in reports by default. When preparing each report, you can delete or edit these default trends and add new trends to the report.

Adding Trends
To add a new default trend, click the “Trends” tab, then the “Add Trend” button.
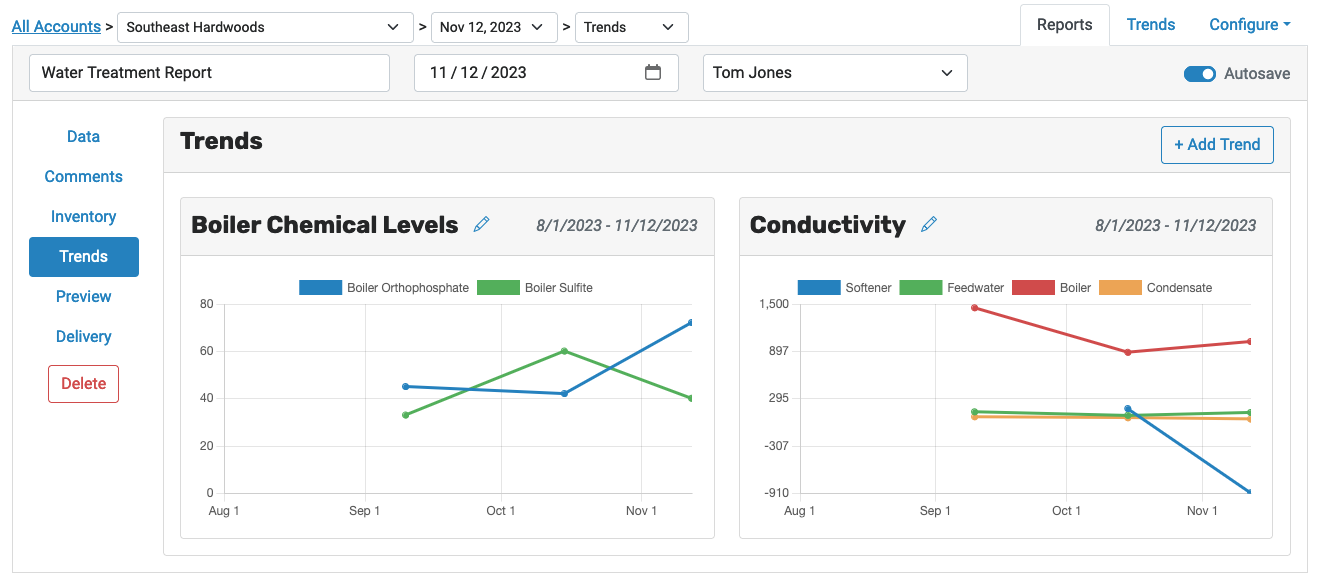
Each report has its own set of trends. To view and edit them, click “Trends” on the report menu:
