Data
After adding samples and configuring tests, you can create a report and enter data for it.
Besides data, your reports may also have trend charts, comments, and inventory.
Entering Data
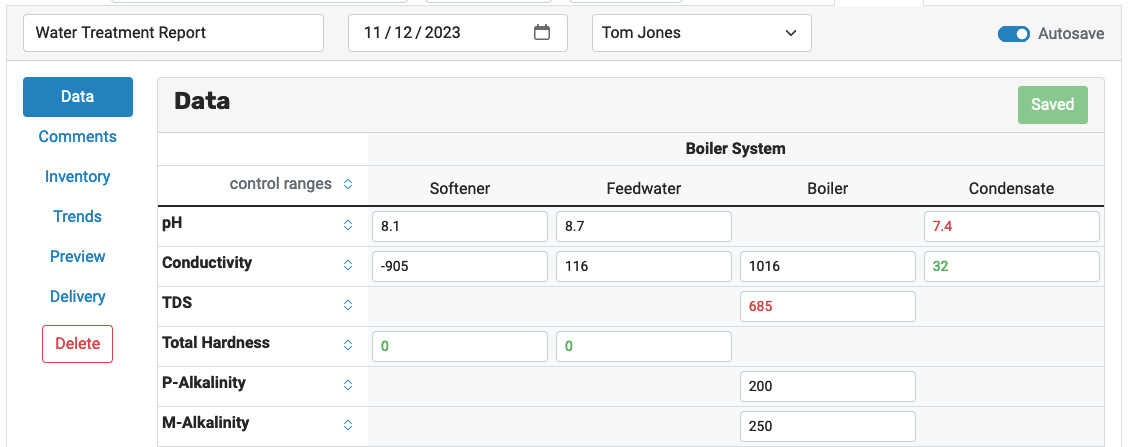
After creating a report, you can enter values on the “Data” screen:
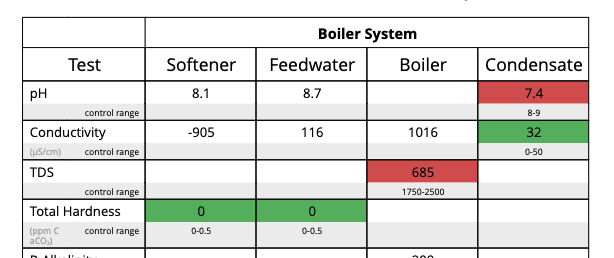
All the values you enter there will appear in your report:
Control Ranges
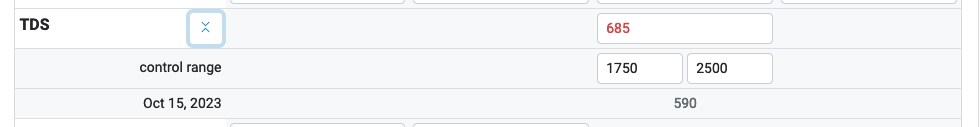
When preparing reports, you can also enter the current control range for each test. To enter control ranges, expand the row for your test:
When the current value is within the configured control range, it’s green in the report; when it’s outside the configured range, it’s red.
When you enter a control range, it will be copied into new reports until the control range is removed.
Submitting Reports
When you’re all done entering data, you can deliver reports directly to your customers, right from Aqualytics.