A New Report Editor
Preparing a report used to mean clicking through a stack of tabs: Data, then Comments, then Inventory, then Trends, then Preview, then Delivery. Now, the whole report is on one page, and it saves as you type.
Everything on One Page
When you open a report, you’ll find its data table at the top, followed by Comments, Trends, and Inventory:
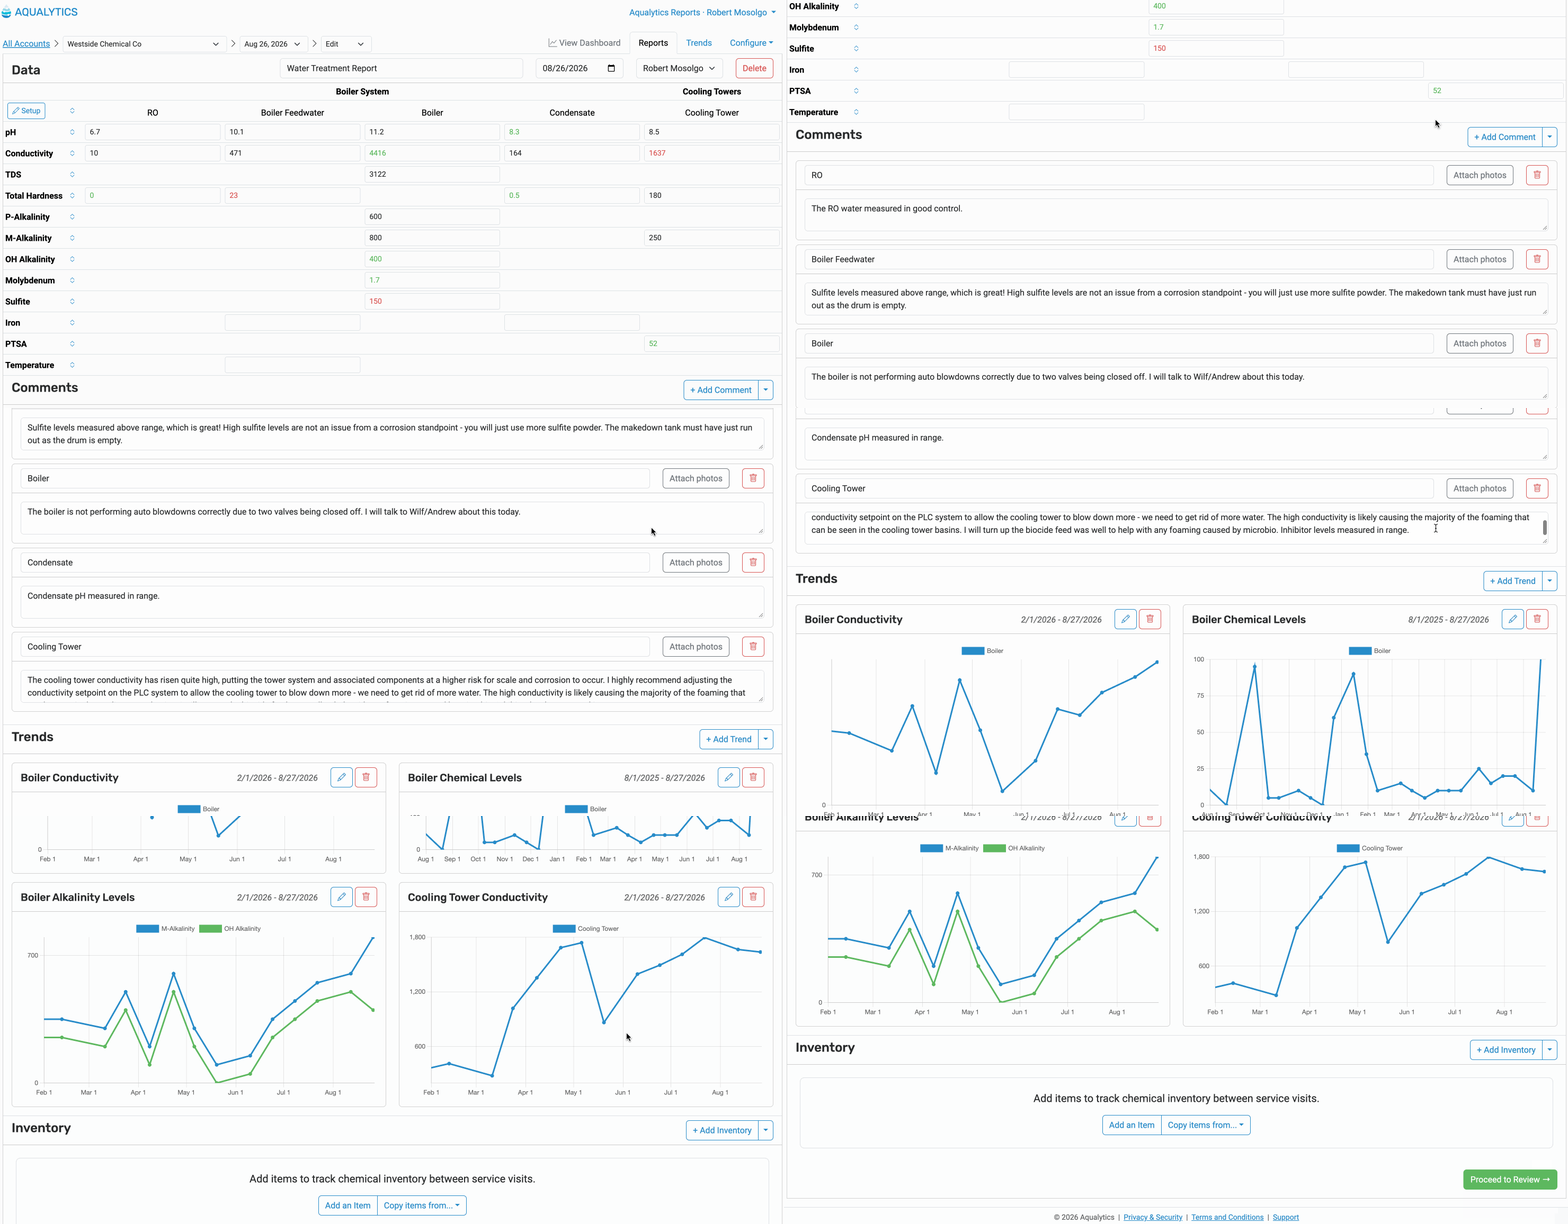
As you enter test results, Aqualytics saves them automatically. Look for the “Saved” checkmark beside the “Data” heading.
Setup for Each Report
Click “Setup” at the top of the data table to change what this report includes:
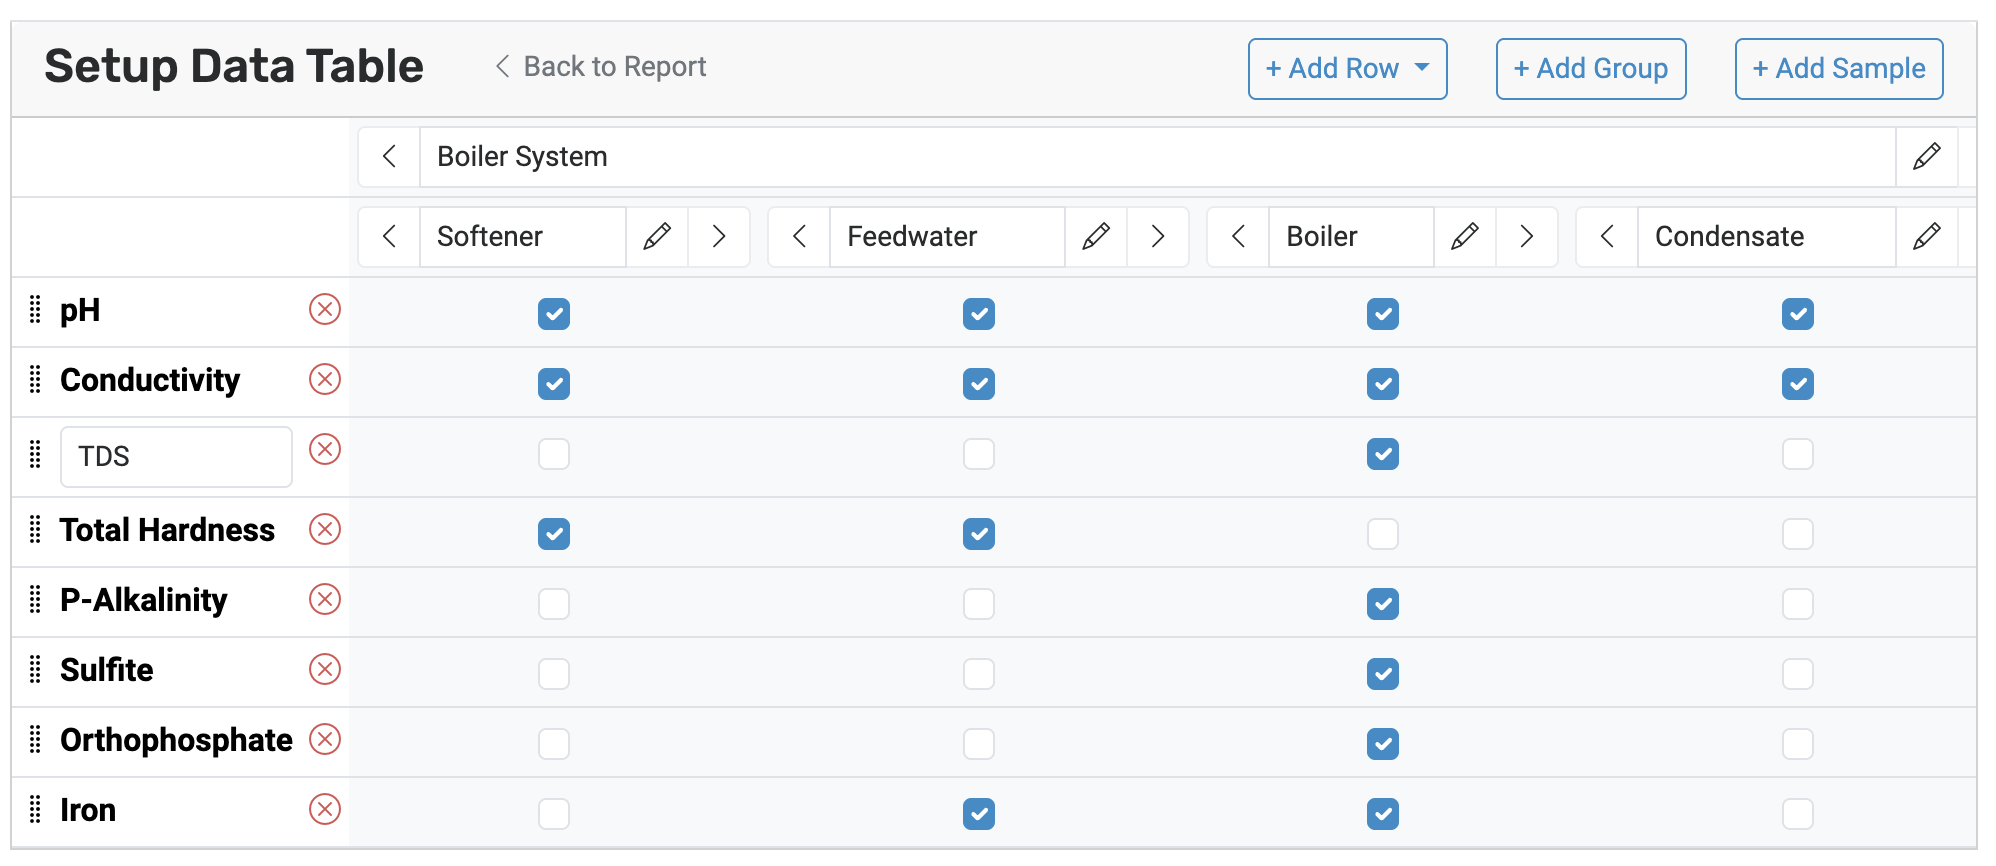
From there, you can:
- Add samples and groups with the “+ Add Sample” and “+ Add Group” buttons
- Add tests by searching the built-in list in the “+ Add Row” dropdown
- Reorder tests by dragging them up and down
- Choose which tests apply to which samples
Changes you make here apply to this report. Reports you’ve already sent stay exactly as they were, so you can add a closed loop or drop a test without rewriting history.
Custom Tests
Is there something you test for that isn’t in the built-in list? Choose “Custom test” from the “+ Add Row” dropdown and give it a name:
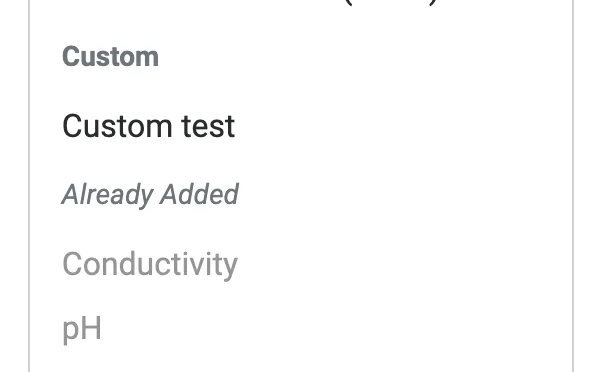
Custom tests work like any other row: you can record results for them, set control ranges, and include them in trends.
Review, then Send
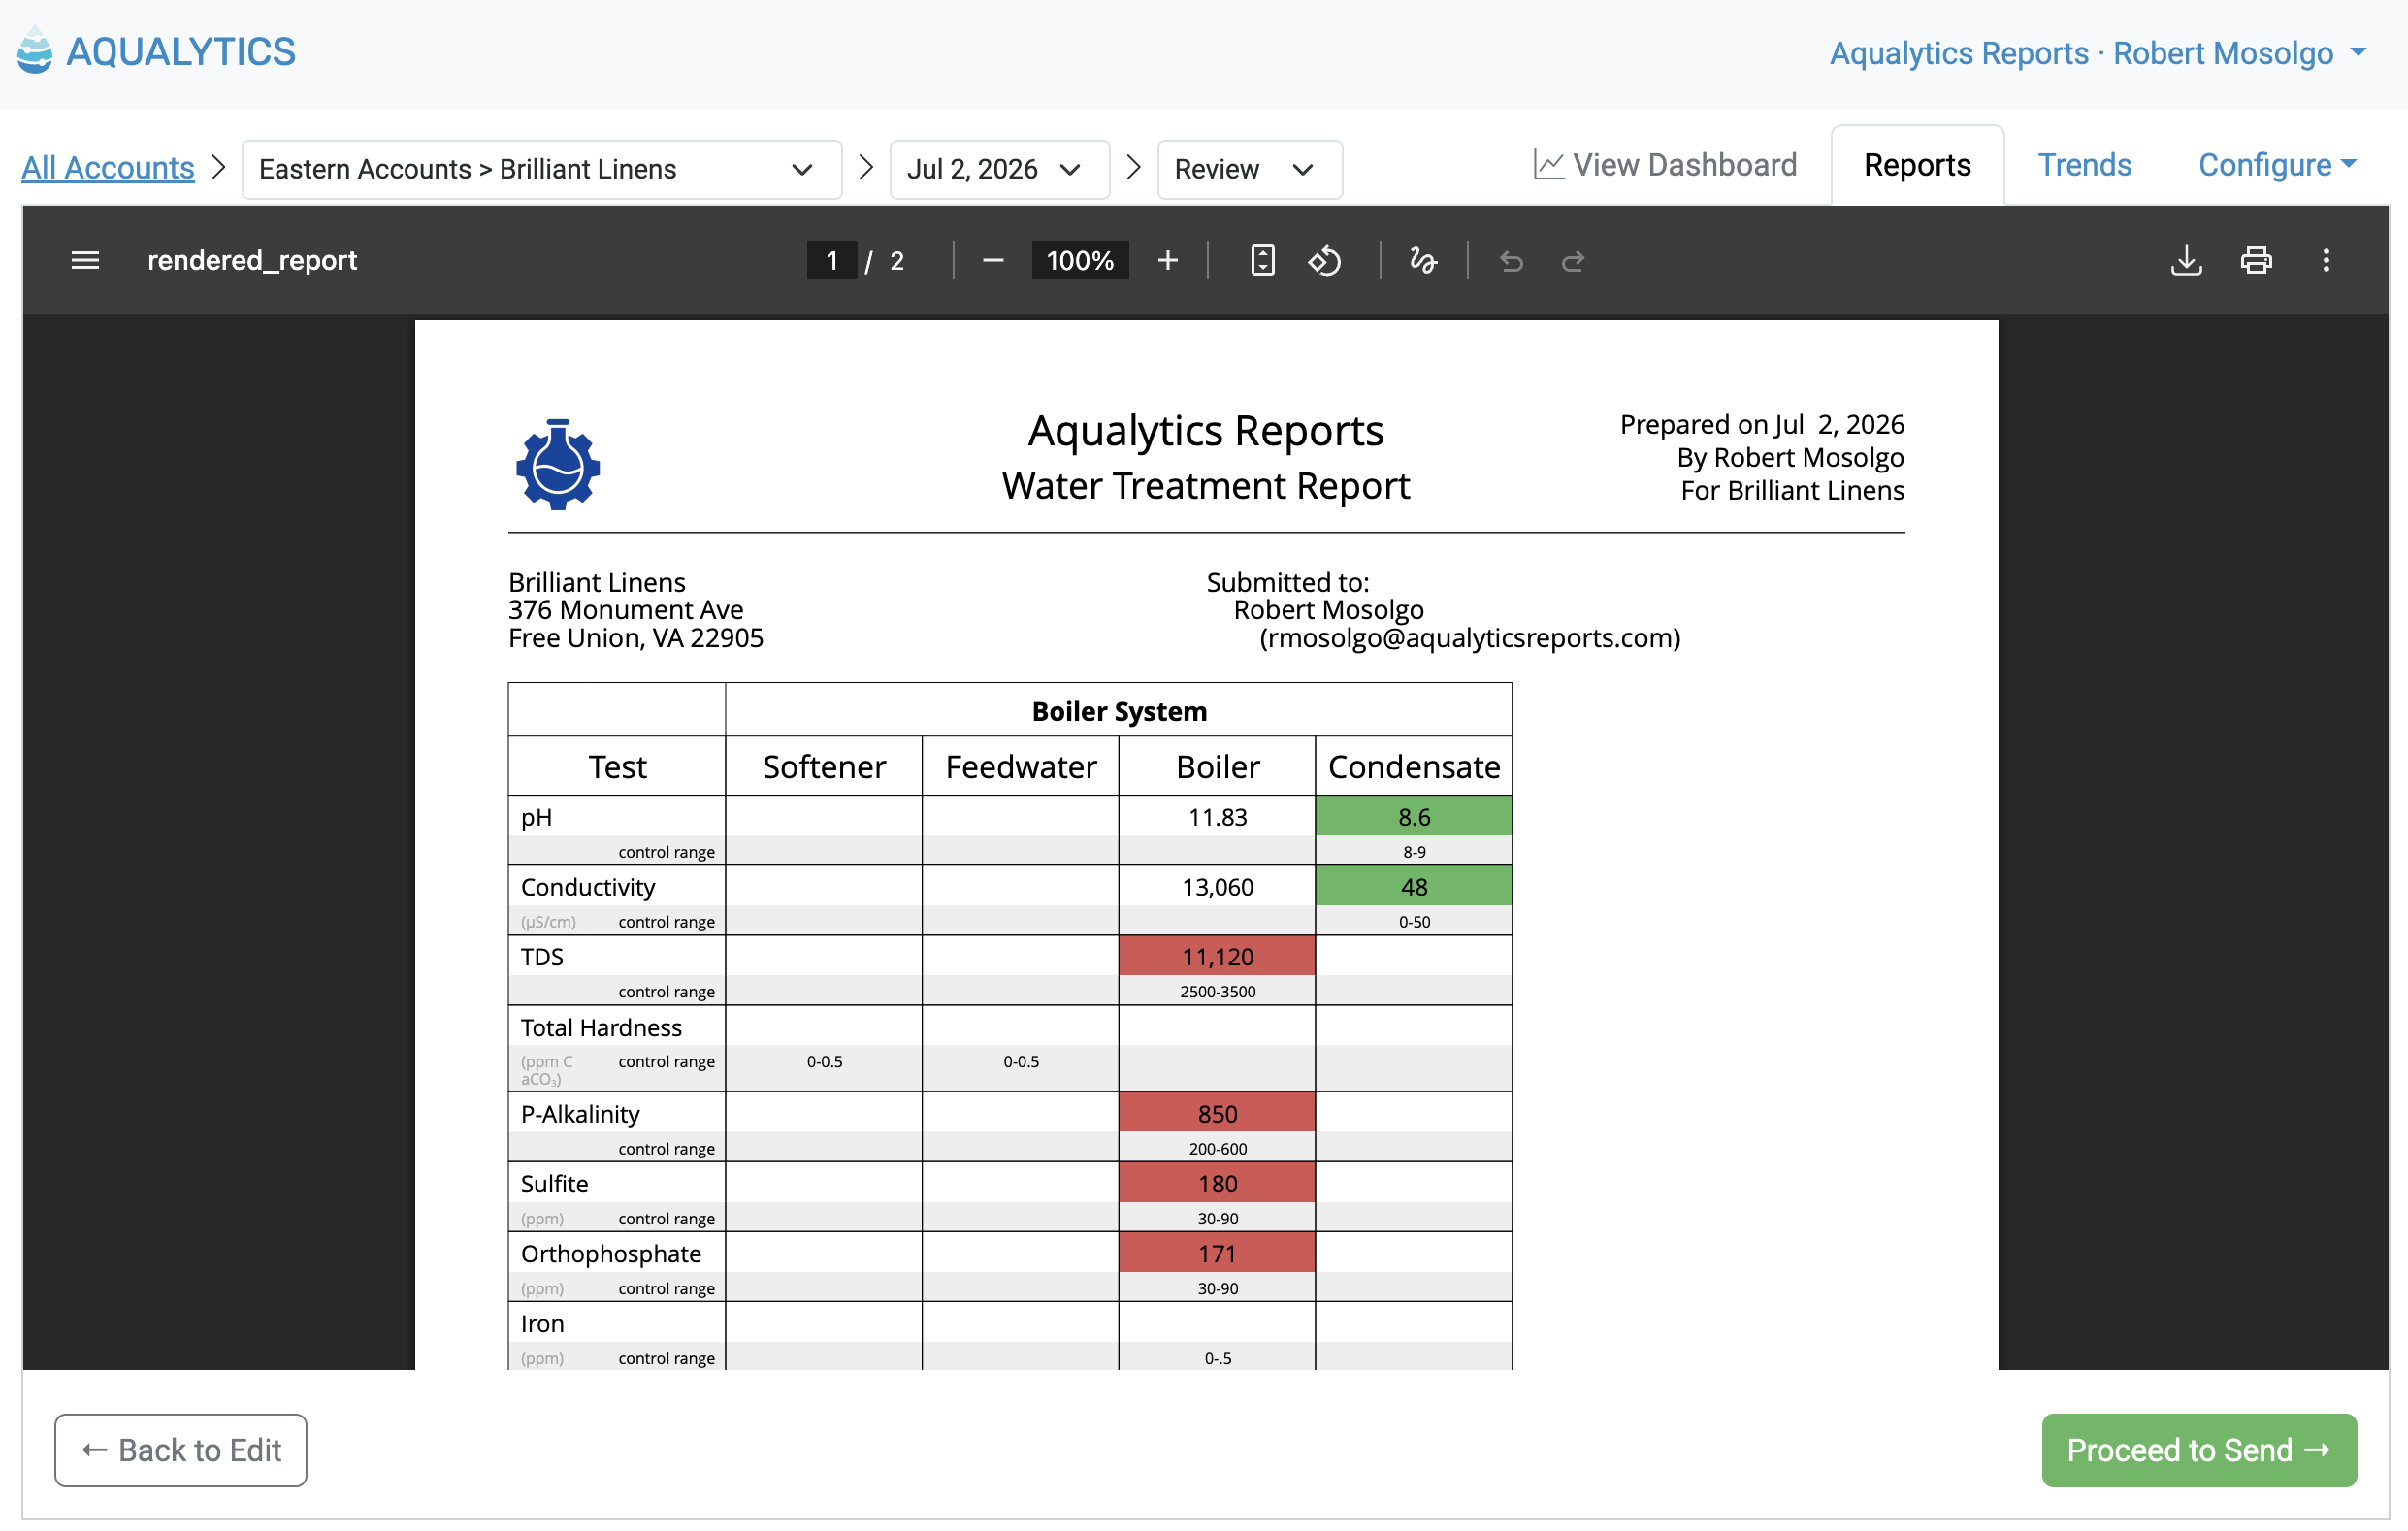
When the report is ready, click “Proceed to Review” to see it exactly as your customer will. If something’s not right, head back to make a change. Otherwise, proceed to send it right away or schedule it for later.
Give it a Try
Your existing reports have already been moved over. Open one up, or start a new one, and let me know what you think!

Ready for better service reports?
Get started with the best software for water treatment service reports.