Example Aqualytics Report
Finished reports can be delivered by email from Aqualytics, or printed or downloaded for any other use.
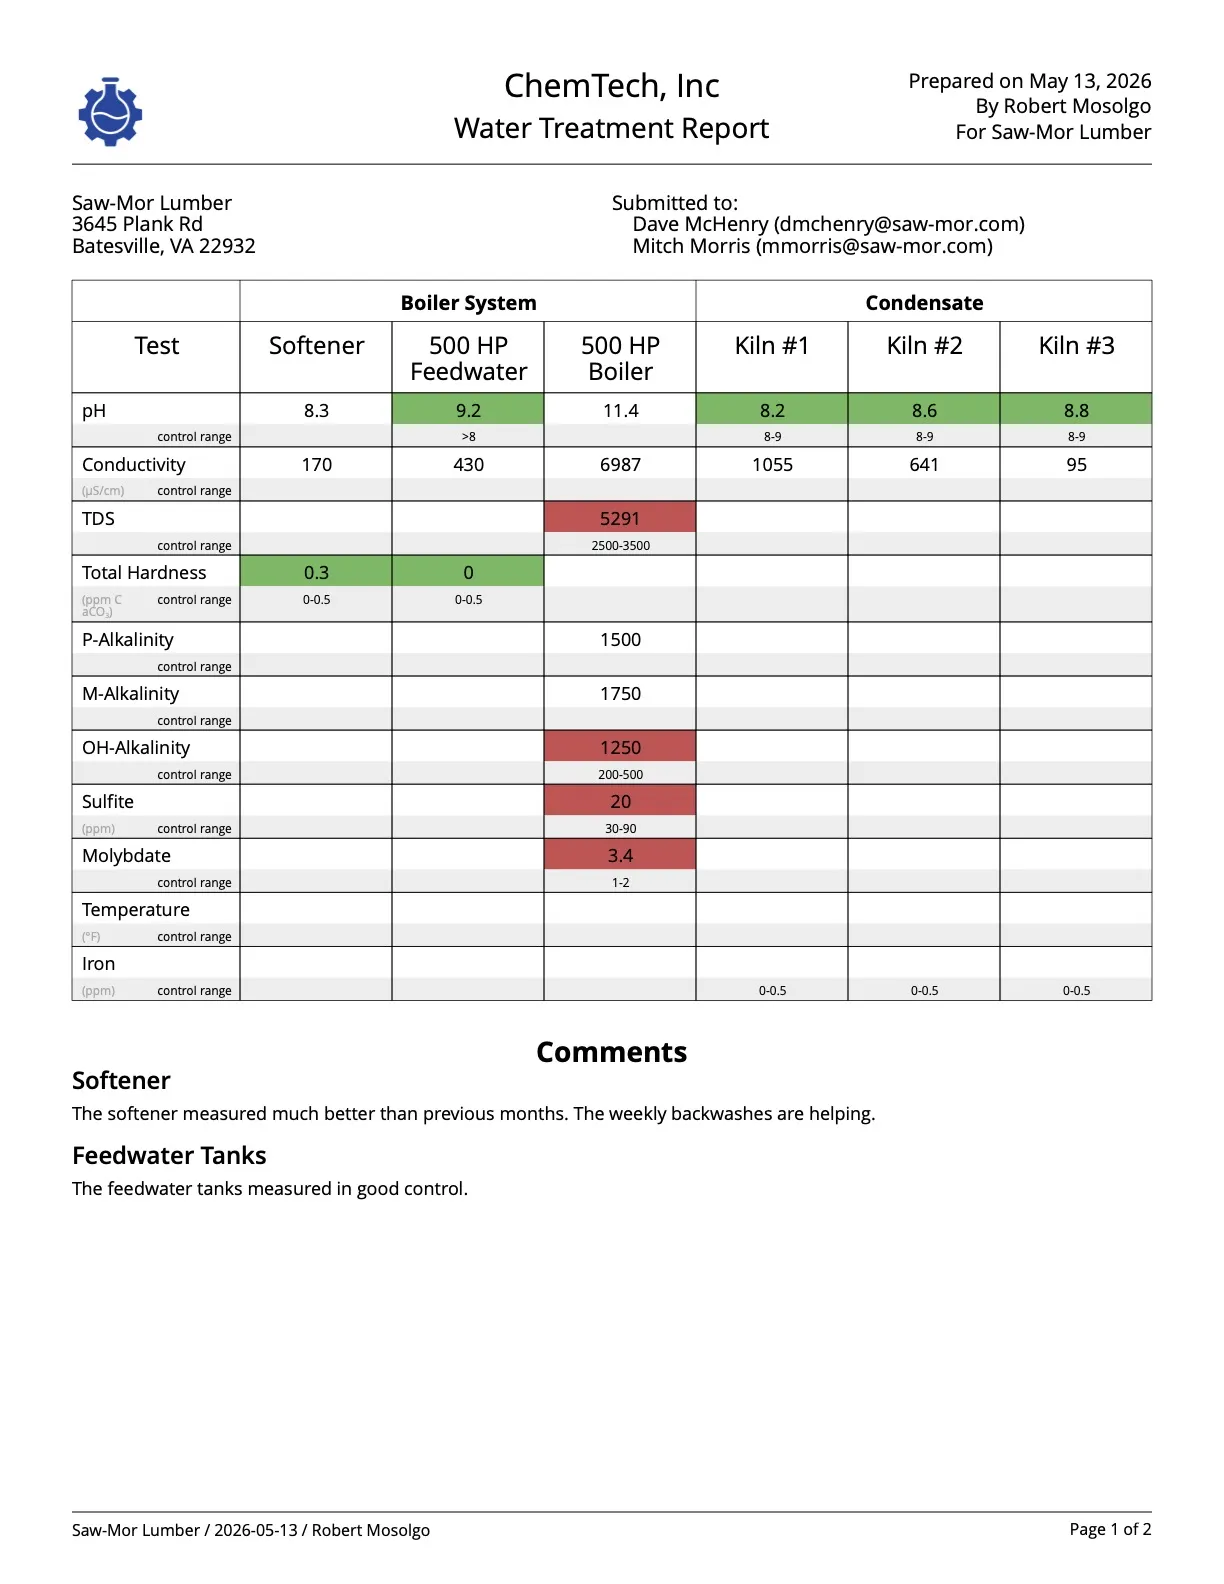
Report Header
The report header has your logo, title, name and recipients.
Data Table
The data table shows test results for each sample that you took and each test that you ran. Reports can have any number of samples and tests with any names you choose.
Aqualytics has built-in calculations for cycles, LSI, and condensate return percentage.
Automatic color-coding based on your configured control ranges shows status at a glance.
Comments
Comments add detail to your report.
Save time on your comments and analysis using templates and one-click copying from previous reports.
Photos
Photos can be attached to your comments. Upload them on your desktop or mobile device.
Trends
Custom charts track status over time. You can build them with any samples and tests that you've reported.
Charts can use any of the samples and tests in the report. They can cover any range from one week to twelve months.
Inventory
You can include chemical levels on each report to help keep an eye on consumption.

Ready for your reports to look this good?
Get started with the best software for water treatment service reports.
Want to see your own report format in Aqualytics? Book a call